

Food manufacturer PoC: DARVIS and ontology-based operating metrics analysis
A DARVIS PoC with a large food manufacturer tested how far a system can go past BI dashboards: tracing causes and proposing the next action.
What is the difficulty manufacturers run into most often when they look at adopting AI?
It is not understanding complex technology or the decision-making process. It is not having a clear answer to the question of where to start.
Bringing in a large solution all at once carries a lot of risk, and it takes a long time before the benefits are felt. Start too small, though, and nothing meaningful comes out of it. It is also hard to judge in advance how AI will work in your own business, or how work will be split between it and people once it is in place.
A large food manufacturer had a clear approach to this problem.
Rather than talking about technology in the abstract, the company settled on operating problems that were actually worth solving, then started a DARVIS PoC with DFINITE. The scope and criteria were set out in the initial meetings, and the work was then validated against business scenarios.
The subject of this PoC was to test how far a system can go beyond showing data: tracing causes and proposing the next action.
There is a reason this subject matters. Organizations that have adopted BI tools share a similar pattern. Data is well organized on screen, but the judgment that comes next is still a person's job. The system handles everything up to spotting an anomaly, but tracing its cause and deciding what to do next is still done by people.
The distance between looking at data and making a decision is longer than you might think. To get from a number on a screen to a decision, several departments have to gather material and reconcile it. Even in organizations whose operating data is fairly well organized, this gap does not shrink.
The start of the PoC: decision safety mattered more than technology

DFINITE and the company first met at a booth at CES 2026 in Las Vegas, and two meetings later this led to the PoC. At the start of this PoC, the topic that came up most was not technical specifications but decision safety.
In a large organization, adopting AI is more than a technical review. If an automated system gives a wrong answer, the decisions based on it become risky. Both sides had to agree on what evidence would let the PoC results carry the project to its next stage inside the organization, and on what material decision makers could present when deciding on full adoption. So from the first meeting, DFINITE did not lead with a technical demo. It stressed three messages first.
Block hallucination structurally: the biggest concern about generative AI is controlled through system structure, not model capability. Because the answerable scope and the source data are defined in advance, the area where AI can freely guess is limited from the outset.
Minimize scenarios: rather than trying too much at once, start within a scope that can be validated. This is a commitment to keep the PoC scope from growing beyond control.
Set the PoC success criteria together: DFINITE does not declare success unilaterally; both sides agree at the start on what counts as success. Setting the criteria at the start keeps the evaluation from becoming vague at the end.
In the second meeting, DFINITE explained the structure of DARVIS around the ontology (a knowledge system that structures the field's decision criteria and the relationships in the data). The point that this was a system with structure, not simply an AI, was well received, and the PoC went ahead on that understanding.
How far should the system go in proposing the next action?
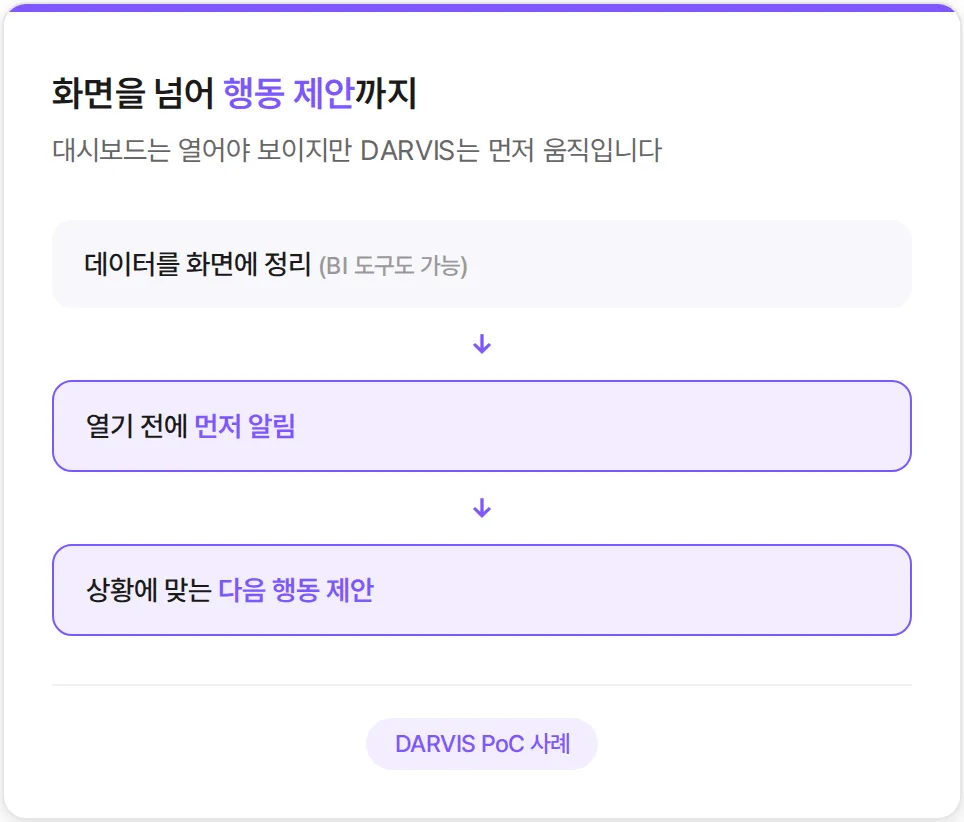
The inventory management scenario starts from a familiar set of features: automatically classifying inventory status, judging whether delivery is possible by channel, and charting item details. This much can also be built with a BI tool. By now, every solution handles the step of showing data.
The difference appears in the next step. In the end, the reason to build an inventory screen is to decide the next action. Once inventory status has been checked, the next action has to be decided, and that judgment always happened outside the system.
DARVIS brought that judgment inside the system. It proposes a recommended action depending on the situation and sends an alert automatically when a set threshold is crossed. With a dashboard, information only reaches people when they open the screen.
DARVIS sends the alert before anyone opens the screen and has the next action proposed in advance. The first difference is that the screen does not stop at showing data; it carries on to proposing an action.
How far should the system trace the cause?
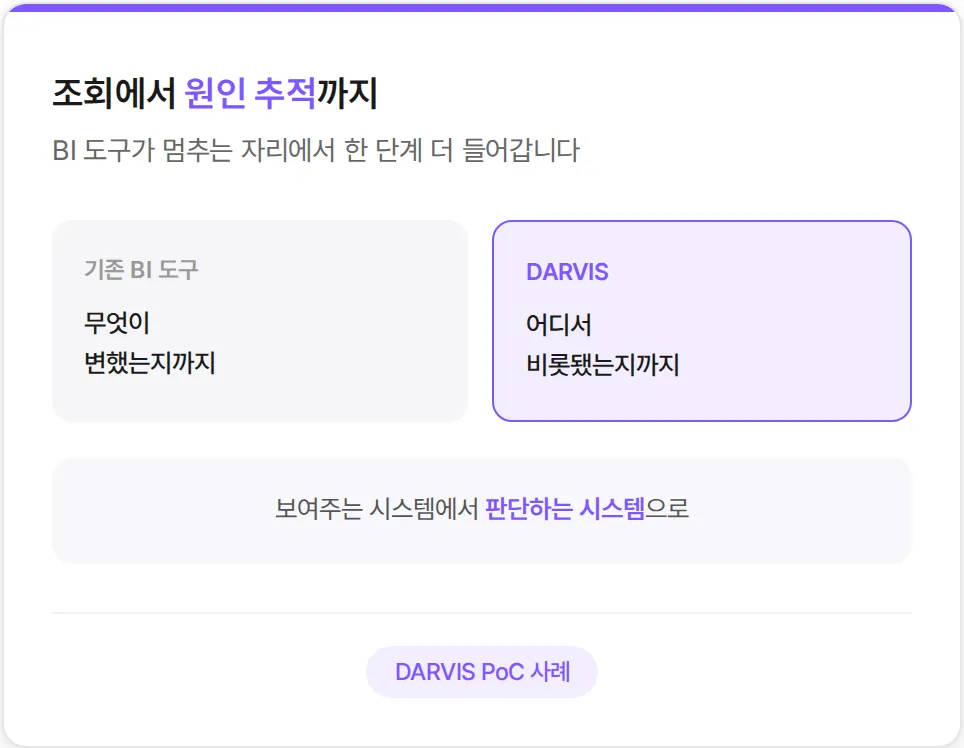
A change in profit and loss always leads to the question of what caused it.
Confirming that this month's margin fell is not hard. Every company produces a monthly P&L report on a regular schedule, and the trend is visible as soon as you bring up the screen. The real work starts after that: finding out why it fell and where to start responding.
If this were one department's job, it would be simple, but in practice it is not. Following a single P&L change all the way to its cause requires material from several departments in one place. Gathering the material takes days, and reconciling it takes days more. By the time decision makers get the report on what caused the change, the next month has often already begun.
BI tools cover the front end of this flow: showing how the margin changed and, at the level of the major line items, where the change happened. Up to this point the system does the work. But following the change further back to where it came from falls to people again. This is exactly where the line between system and people is drawn.
What DARVIS validated in the PoC was moving that line toward the system.
Where a BI tool shows the major line items and stops, DARVIS follows the cause one step further. The system breaks the change in a major item into smaller units and lays out where the biggest change occurred. Previously, this was work people did by hand, with several departments passing material back and forth.
BI tools stop here not because they lack features. From the next step on, the work is no longer simply showing data but judging where to look for the cause of a result. Deciding where to look first was a human judgment, and the BI tool's role ended at taking that judgment and redrawing the screen.
DARVIS was designed to build this judgment flow into the system, scenario by scenario. When a P&L change is detected, the order of what to examine and how far to go is already laid out, and the flow runs automatically within it.
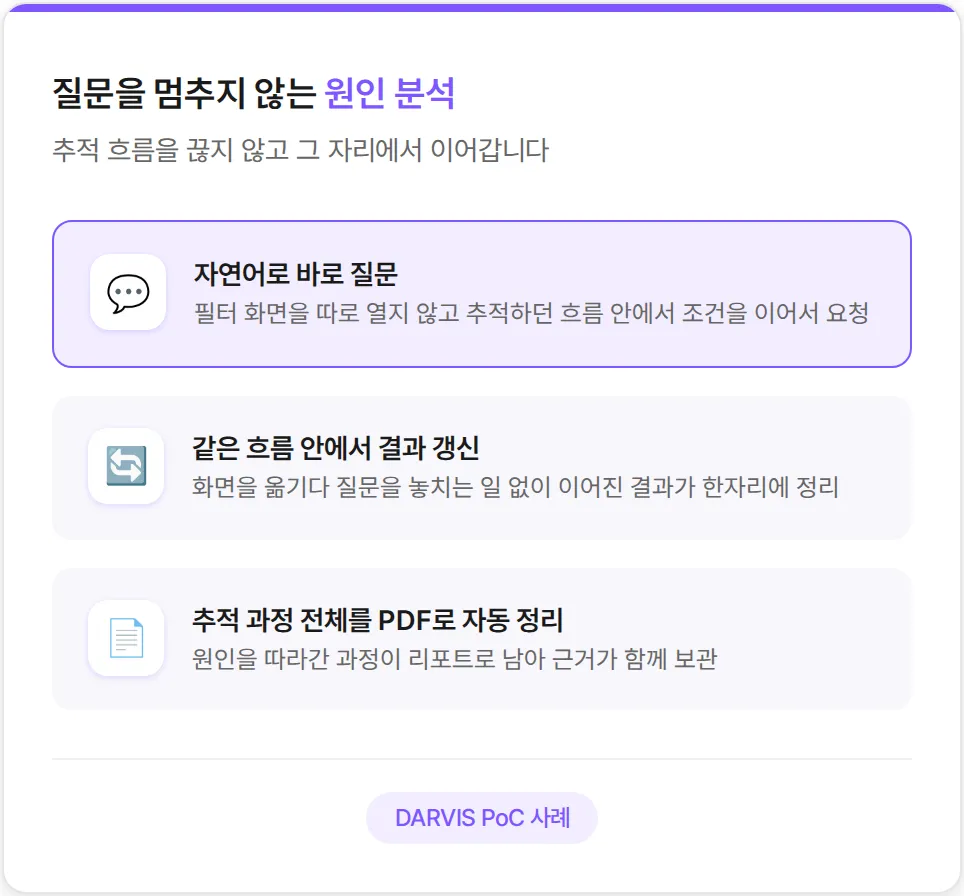
From a system that shows screens to a system that holds part of the judgment: that is the change this PoC validated. Natural-language queries sit on top of this flow.
When you want to add a condition while following a cause, you can ask in natural language instead of leaving for a separate filter screen. In existing BI tools, adding a condition meant switching screens, finding the filter options and bringing up a new chart. Questions that come to mind while looking at the data are often forgotten in the time it takes to switch screens.
In DARVIS, you can keep asking questions right where you are without breaking the flow you were tracing, and the results of those follow-up questions are organized within the same flow. At the end, the entire tracing process is compiled automatically into a PDF report.
This PoC confirmed that this flow actually works.
A structure in which data does not leave the company

For everything described so far to work, one more condition applies: data security. In scenarios that handle operating data, a setup that sends data outside is hard to take forward even at the review stage.
DARVIS was validated in a controlled environment that took the customer's security requirements into account. Security requirements were built in so that operating data would not be exposed externally. Natural-language queries, cause tracing and action proposals all work inside this security boundary. Here the early agreement on a structure that is safe for decision-making carried through into the technical design.
Beyond lookup to judgment

Showing data well on screen no longer sets a product apart.
The real difference is how far the system can handle the step after the screen: tracing causes and proposing the next action. The inventory management scenario shows that difference at the point where the screen leads into a proposed action; the P&L analysis scenario shows it at the point where the system's reach extends to cause tracing.
What this PoC confirmed is that this flow actually works. How it settles into live operations after adoption, and its quantitative effects, are questions for the next stage. After the PoC ended, talks with the company moved to the main-contract stage, and improvements based on feedback from the business teams are under way.
Any organization that has adopted BI tools would do well to look at how far its own systems show things and where the work passes to people. If, when a result comes in, the next step is still left to people, the starting point for the next review is where that line is drawn and how far it can be moved toward the system.
DFINITE is a company that solves manufacturers' operating problems with AI. Instead of replacing existing systems, it adds operating criteria and data connections on top of them, building a structure that goes beyond lookup to judgment. To learn more about how DARVIS works, see the DARVIS brochure in the Brochures menu at the top of this page.
We join scattered data with an ontology, flag what drifts first, and keep the evidence behind every decision.